This is part 1 in a 3-part series on Trump Accounts. In summary, Trump Accounts are free money for...

At Virtus Wealth Management, your Southlake independent financial advisors, we help our clients prepare for a financially-secure future by developing long-term strategies that focus on the “big picture” versus short-term gain, thereby managing risk.
Today’s economic conditions and uncertain financial markets require the savvy investor to go beyond traditional boundaries.
Our mission is to provide innovative, sophisticated and highly customized wealth management solutions and financial advice that address all facets of your finances.
We tailor everything to each of our clients’ specific needs so that each client can pursue his or her different goals.
Virtus Wealth Management is the product of a 2016 merger between two well-established Texas wealth management firms.
Wealth management is more than just investment advice – it includes all aspects of a client’s financial life.
This is part 1 in a 3-part series on Trump Accounts. In summary, Trump Accounts are free money for...

This is the last article in our HSA series and goes into detail regarding strategies that could be...
Wealth management is more than just investment advice – it includes all aspects of a client’s financial life.
At Virtus Wealth Management, we believe we can help you no matter what age you are, what life stage you are in, or how much money you are working with. We want you to feel educated, empowered, and involved in the planning of your financial future.

“It is tough to make predictions, especially about the future.” Yogi Berra
A question I get a lot is if the market has bottomed and if not, when will it bottom. It must be stated if anyone could predict the market tops and bottoms, not only would they be on a beach right now but they would own the entire island. The market is NOT a logical system short-term. Long-term is very logical. Follow the earnings. Short-term is driven too much by emotions.
I don’t know if we have hit a bottom, and I have long lost the illusion that I or anyone else can say, but I do have some signals I look for in order to get more aggressive. When I state more aggressive, I don’t believe in going all cash. However, we do have ranges in each of our portfolios that go from less to more aggressive within the same risk tolerance. For example, a moderate client can have anywhere between 40% to 70% in stocks. In this case, I am waiting to increase our stock portfolio mix.
Regardless, these signals are in many cases specific to the situation at hand. Some are more technical while some are more economic. In the situation we find ourselves in today, following are some signs I am looking for in order to get more aggressive.
Inflation peaking, which we appear to be doing so as of this writing. As long as inflation was rising, the market would be uncertain about the level of rate increases by the Fed. The market typically doesn’t treat uncertainty well.
Second quarter earnings announcement, specifically future guidance. We know the growth of the economy is slowing. Depending on which side of the political aisle you may land on, we may or may not be in a recession. Doesn’t matter what you call it, GDP is going the wrong direction. However, don’t get too caught up on that because that is in the past. What is important isn’t as much 2nd quarter earnings but rather moving forward. What are the expectations of the executives out there going forward?
These two indicators are actually good news in the market right now. It might be premature to say that future guidance is definitely good news because we are still in the midst of the second quarter earnings announcement, but so far so good. Inflation appears to be peaking. Core inflation has peaked as supply chain issues have been improving. The biggest driver of June’s inflation increase was energy but even that has been subsiding as well since then. (Source: Bloomberg.com) The one major concern regarding inflation for me is it will be very difficult for the Fed to get control of inflation as long as there is wage inflation. As long as unemployment is historically low and we have wage inflation, inflation overall is at risk. Just because core inflation appears to be peaking doesn’t mean it is going back below 2%.
I know some are waiting for the Fed to stop raising rates but I believe the market will already rally before that. Also, valuations are great only if you can trust the future projections, which is why understanding the impact on future guidance this quarter is very important.
A double bottom. There are many bear market rallies in a market continuing to decline. Markets do not go straight up or down. In every bull market there are small corrections before the market continues to go up. The reverse happens in bear markets. A double bottom is when the market drops to a certain level, has a market rally up, then drops again but stops at the previous bottom. Then starts to move up again. Those are typically good news. They are not 100% accurate though. In 2020, during the covid bear market, stocks rallied approximately 60% from the low without ever seeing a double bottom. (Source: Stockcharts.com)
Follow the volume. More important than a double bottom for me is what we call follow thru volume in a rally. As mentioned before, markets do not go straight up or down. Typically, there will be several little rallies in a bear market. These are many times just head fakes. What you see many times is a nice short-term rally that starts with decent volume (buying and selling of shares). As the rally continues, volume falls off significantly, i.e., less people are buying, only to be followed by a renewed downtrend. I like to see follow through volume in a rally. The market rallies and then slows only to see a big increase 3-5 days later with higher volume. Below is a case of a head fake earlier this year.
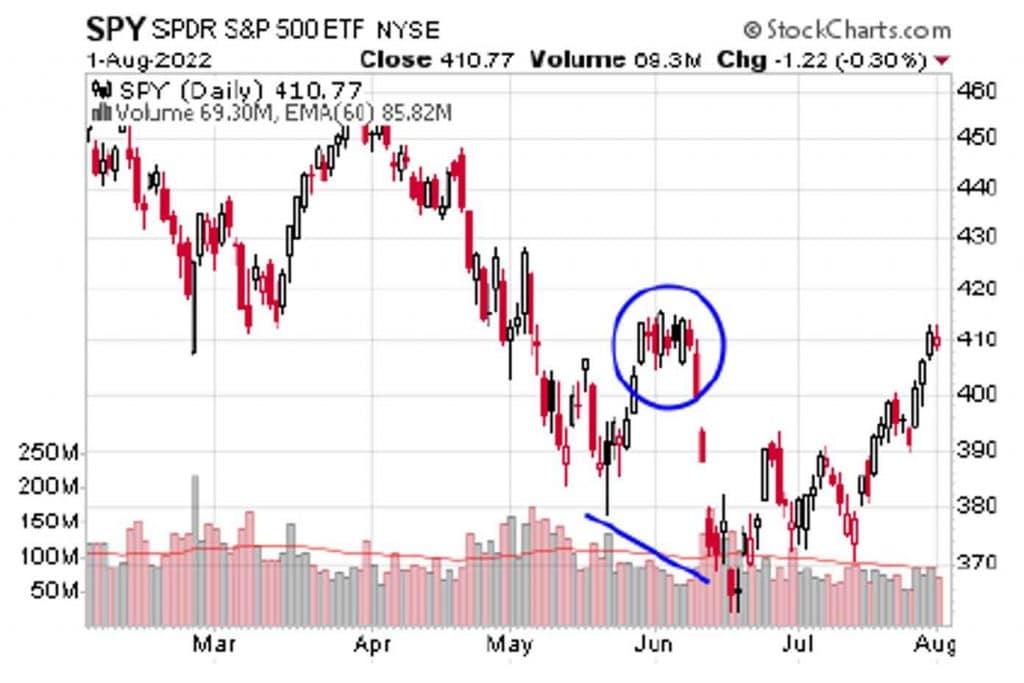
Source: Stockcharts.com
As you can see, a rally, which is identified by the red and white bars above, started in late May (noted by the circle). The red and gray bars at the bottom of the graph are volume. Gray being volume on a positive market day while red represents volume on a down day. As noted, the rally started with a nice volume day only to be followed by less and less volume as the market rose. The rally fizzled out and the market resumed the downtrend.
I am not as big of a fan of some specific percentage drop being some buy sign because it assumes that all over-valued markets are equal. Specifically, if someone says always buy if a stock drops by 30% (as an example) or worded “it is a buy because it is 30% off the high for the stock,” it assumes the starting point is always the same. What about bubbles, which I have been claiming we were in for most of all 2021 in growth stocks? Go look at tech stocks in 2000 and 2001. Microsoft hit $36.4 (split adjusted on 12/17/1999. On March 13, 2000 is was 30% off the high at $25. One could have bought with the strategy; it is a 30% off the $36 price. True, but guess how long it took for the stock to get back to $36? It didn’t get back until June of 2014. Why? Because it was very over-valued at $36 in 1999 and somewhat over-valued at $25 in 2001 and it took 13 years to get back to the high (an annual 3% return). Now one could argue it is at $250 today so it was a good buy in 2000. True but that had nothing to do with it being 30% off its high. One would have been much better waiting until valuations were much more favorable and bought much lower than $25. I will also bring up Network appliance. It hit approximately $150 in late 1999. 30% of that is $105. Today it sits at $72. In my opinion there is no magic number when it comes to percentage off a high. (*)
That is what I am looking at right now. One important point I would like to emphasize is the news isn’t all bad right now. Remember to focus on your long-term goals and not let market volatility or emotions deter you from your plan. If you are uncertain or worried about how much risk you are taking in your portfolio, call to speak to me or one of our other advisors today.
(*) Source for all stock prices indicated in this paragraph is from Microtrends.
The opinions voiced are for general information only and are not intended to provide specific advice or recommendations for any individual.
All performance referenced is historical and is no guarantee of future results.
All indices are unmanaged and may not be invested into directly.
Stock investing includes risks, including fluctuating prices and loss of principal.