I am sharing with you some of the information the Life Insurance Marketing and Research...


Well, we all agree that 2023 is not off to good start. Inflation rages on, interest rates continue to rise, supply chain issues remain, the war in the Ukraine persists, and, subsequently, the market is volatile. Lions and tigers and bears … oh my!
I encourage you to “take heart”. It may not be as bad as it seems, so let’s go at this based on your unique perspective. What kind of investor are you?
This is the investor who wants to go to cash to keep from losing everything, but history shows that getting out of the market now is one of the worst things an investor can do.
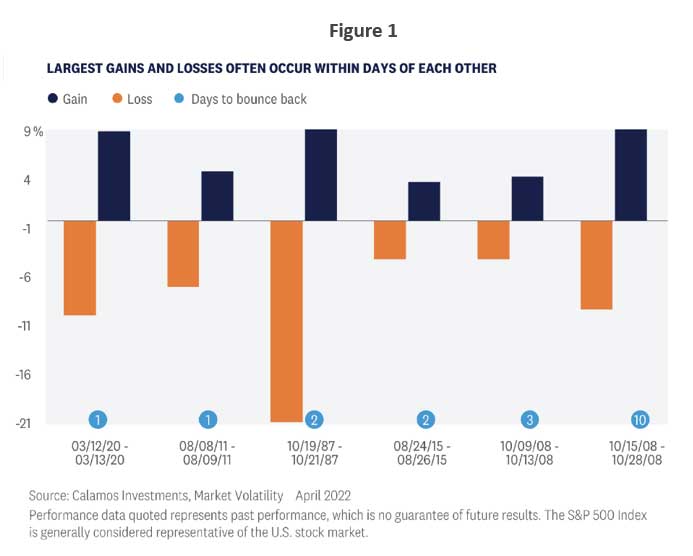
From 1990 to 2020, the S&P 500 Index’s annualized gain was 7.5%, while the average equity investor’s return was only 2.9%. A difference of 4.6%.1 Why? The market’s largest gains (and losses) often occur within days of each other [see Figure 1 below]. If an investor moves to cash whenever the market drops and attempts to “time the market” and get back in at the optimal moment, they are likely to lose out on 4.6% in returns over 20 years like the average investor.
This is the investor who listens to the news. Let’s face it, falling stocks make good headlines, and the media is less likely to present a balanced view with other economic indicators. While the news and consumer sentiment may tell you one thing, the data may tell you something different.
This is the investor who leans into history. While past performance is no guarantee of future results, history can be a helpful guide for future possibilities.
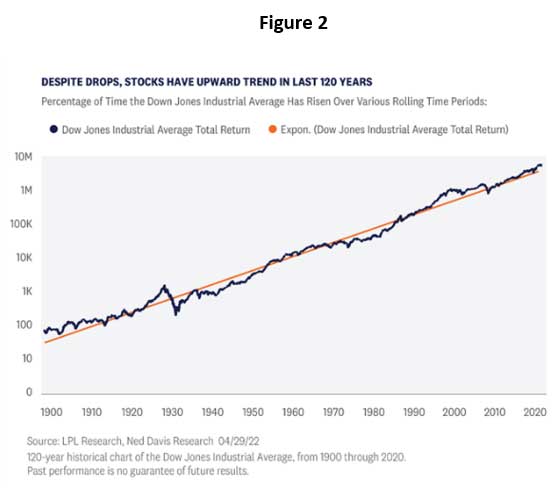
Short-term volatility comes in waves, but stocks have an attractive record over the long term. For example, the Dow Jones Industrial Average, which has a longer history than the S&P 500, has trended up overall over the past 120 years, despite several downturns throughout the time period [Figure 2].
Since 1950, the S&P 500 has risen 83% of the time across a five-year horizon and 100% of the time across a 20-year horizon [Figure 3]. When starting from an already depressed market, the risk/reward tradeoff is even more appealing. If you think about it, this ebb and flow makes sense and is necessary for people to make money when investing. When stocks decline, there’s opportunity to buy at a lower price and get a higher return on the backside. When stocks are high, people sell and make money, but of course, ultimately forcing another ebb.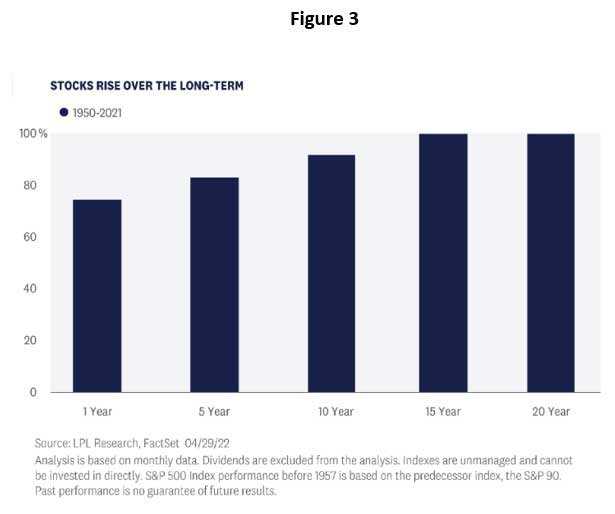
This is the investor that relies on numbers and analytics to stay the course on their investments, and there are numbers that indicate solid prospects for a second half rebound.
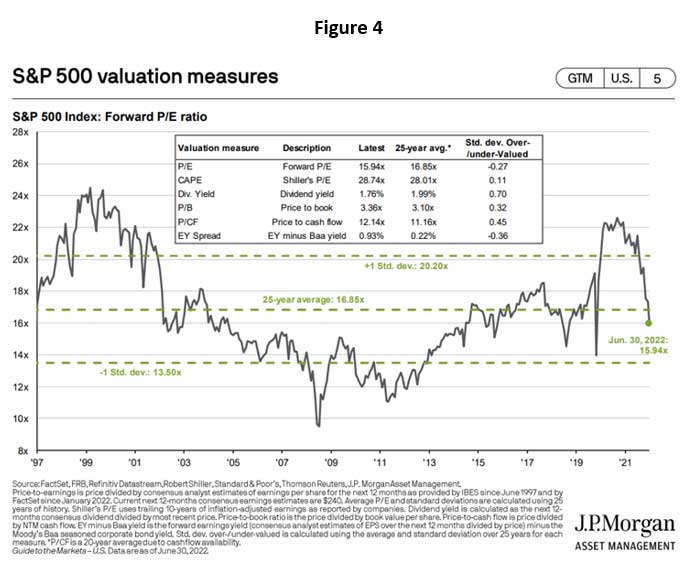
Valuations are reaching less than average levels indicating that we may be nearing a bottom and reaching a buying opportunity. That’s not to say that a well-priced market couldn’t get cheaper, but prices are better now that the froth is gone. Buy, hold, or sell … let the numbers guide you [Figure 4].
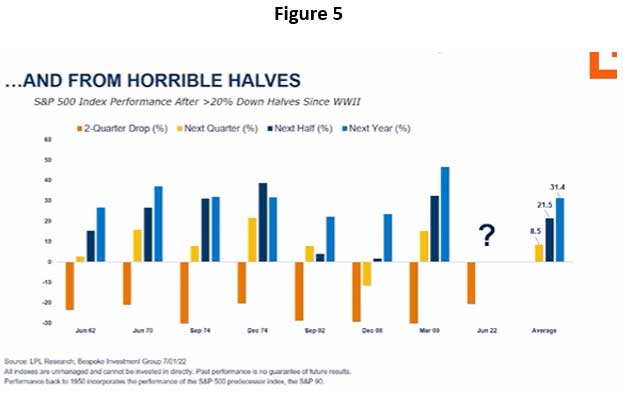
Stocks historically bounce back strongly after bad halves. The average gain is 8.5% the next quarter, 21.5% the following two quarters, and 31.4% the following year [Figure 5]. Interesting. Where do we go from here?
So, as I said before, “take heart”. The lions, and tigers, and bears may not be as they seem at first glance. It takes short-term pain for long-term gain. Think long-term. Use different perspectives to keep you focused and let Virtus Wealth Management help keep you on yellow brick road to your long-term goals.
1Source: LPL Research, Bloomberg, DALBAR, ClearBridge Investments 6/30/21
2Source: “June retail sales jump 7.5%, beating expectations,” The Hill, (June 2022).
The opinions voiced in this material are for general information only and are not intended to provide specific advice or recommendations for any individual. All performance referenced is historical and is no guarantee of future results.